
Fortinet FortiMonitor 100F
Endpoint-to-Application Digital Experience Monitoring
Overview:
FortiMonitor is a monitoring platform that gives your operations team unmatched visibility to the end-to-end performance and digital experience. You can observe applications and services, from multiple vantage points, across any network, and even the infrastructure on which the application is hosted. FortiMonitor centralizes and consolidates the monitoring of endpoints, network devices, infrastructure, applications, and cloud services with a single, SaaS-based platform. It enriches and automates incident management and enables rapid troubleshooting and remediation of digital experience issues, mitigating against business and user impact.
Traditional performance monitoring tools lack the end-to-end visibility necessary to monitor and troubleshoot digital experience. IT teams often struggle to gather data from traditional performance tools to gain the end-to-end insight necessary to troubleshoot and optimize endpoint to application experience, a time-consuming, cumbersome task.
FortiMonitor is designed to give your operations team the ability to observe endpoint to application performance and digital experience. It also enriches incident management by correlating metrics and diagnostic data and automates response with run-time playbooks and workflow integration. The combination enables crossfunctional teams to collaborate and remediate issues faster, more efficiently and to continuously improve digital experience.
Business Outcomes
Increase Customer Satisfaction Ratings
- Observe beyond the network, replicate endpoint to-application interaction to easily identify potential digital experience issues
Improve Employee Productivity
- Adapt to any environment, enabling monitoring from the end user’s device, across any network and into the infrastructure that hosts the critical application. It does not matter if it is onpremises, hybrid, or private or public cloud
Increase Operational Efficiency
- Deploy automated actions and build workflows to diagnose and remediate issues leveraging automated runbooks. This automation reduces time spent diagnosing, triaging, and remediating an incident
Ensure Business SLAs
- Report on historical uptime data to provide transparency on service delivery and business SLAs
Deploy Key Component 100F Appliance
FortiMonitor is a cloud-native, vendor-neutral, SaaSbased monitoring platform offering key strengths in digital experience monitoring, FortiOS and Fabric integration, and importantly, network device detection and monitoring. Furthermore, with offerings such as Incident Management, NetFlow and NCM, FortiMonitor quickly becomes a platform of tool consolidation and workflow centralisation.
Importantly, one of the key components in the FortiMonitor deployment strategy is the FortiMonitor OnSight Collector appliance. The FortiMonitor Onsight appliance is perhaps the most ubiquitous of facilities in the FortiMonitor toolbox, offering a plethora of network level insights, including FortiOS Insights, all in a single appliance.
The FortiMonitor 100F comes fully prepared with everything you need to quickly get up and running, but with the added benefit of a “plug and play” deployment strategy. This unit brings significant compute capacity right to the edge—to the end-user environment, network, and remote branch location.
Out of the box, the 100F is designed to support maximum volumes of metric collection as follows:
- 150,000 SNMP metrics
- 2500 VMWare instances (hosts, clusters, VMs, datastores)
- 4500 synthetic network checks (ping, HTTP, HTTPS)
- 100 browser-based synthetic checks
However, if you wish to deploy FortiMonitor Onsight appliance where a requirement exists for values beyond these specifications, FortiMonitor has this prospect taken care of. Using the feature of “OnSight Groups” (a FortiMonitor configuration option) it is entirely possible to harness the abilities of multiple Onsight units operating in HA / LB tandem, depending on your configuration.
Upon deployment, the initial setup is performed locally on the device itself, and once that’s complete, all administrative and management functions are streamlined through the webbased FortiMonitor control panel. This approach gives the FortiMonitor 100F a familiar look and feel. Enabling monitoring at scale has never been so easy.
Core Components
Digital Experience Monitoring
FortiMonitor consolidates monitoring data into a single SaaSbased platform which collects telemetry across complex, hybrid infrastructures. FortiMonitor visualizes the information in a unified capacity, enabling seamless correlation. The solution:
- Centralizes monitoring of the end user, network, and infrastructure that hosts your applications to lower costs, increase efficiency, and optimize resources
- Performs synthetic testing from multiple vantage points to monitor application uptime, user experience, and performance
- Improves customer and end-user experience by proactively identifying service degradation
- Correlates network and application performance data to quickly pinpoint root cause of issues
- Leverages endpoint performance data, such as CPU, memory, disk, and network metrics, along with network and application performance. This facilitates troubleshooting with insights into what the user is experiencing
Comprehensive Full Stack Visibility and Fortinet Fabric Integration
FortiMonitor uniquely offers the ability to observe health and performance of all of your devices, across any network, and the infrastructure that applications utilize, whether containers, cloud, on-premises, or hybrid.
- Monitors status and health of end-user devices, network, cloud, and on-prem infrastructure, public, or privately hosted applications.
- Integrates with the Fortinet Security-Fabric to easily discover and gain insight into FortiGate and downstream Fortinet device health and performance metrics, including LAN, Wi-Fi, and SD-WAN.
- Simulates application-specific traffic over SD-WAN underlays to accurately measure real-time user experience and application performance over SD-WAN
Enriched Incident and Event Management
FortiMonitor enables organizations to observe, correlate, and respond to incidents from a single unified platform. Organizations can:
- Enrich incidents by automating the diagnostic collection and designing remedial measures with automated runbooks, allowing teams to fully customize their incident handling experience at scale
- Maximize team collaboration through native timeline and messaging communication features, accelerating response coordination
- Ensure critical events trigger notification of team members instantly, through email, FortiMonitor mobile application, and SMS alerting
- Eliminate fragmentation with a single source of reliable data insights
Automation
FortiMonitor enables a network operator to respond to performance issues with flexible automated runbooks. These can be tuned to an organization’s best practices to accelerate operational and response tasks. Benefits of automated runbooks include:
- Reduction of repetitive manual tasks and high-volume context switching
- Accelerate mean time to detect (MTTD)/mean time to response (MTTR), while improving service delivery, permitting teams to meet and exceed SLAs
- Proactive optimization of processes and resolution of incidents
- Swift deployment of automation for immediate use and onboarding
Feature Highlights
- Comprehensive Performance Monitoring: Monitor endpoints, vendor agnostic network devices, infrastructure, applications, and cloud services with a single, SaaS-based platform.
- Endpoint Digital Experience: Leverage endpoint performance data, such as CPU, memory, disk, and network metrics, along with network and application performance to facilitate troubleshooting with insights into what an end user is experiencing.
- Fortinet Fabric Integration: Discover and monitor FortiGate and downstream Fortinet device health and performance metrics, including LAN, Wi-Fi, and SD-WAN.
- Flexible automated onboarding: Easily onboard FortiGate and connected FortiAP, FortiSwitch and FortiExtender devices
- Auto Discovery : Network-wide SNMP device discovery. Host and guest performance of VMWare , Kubernetes Helm
- Cloud Integrations: AWS, Azure
Security Fabric:
FortiMonitor integration with the Fortinet Security Fabric enables organizations to import all eligible Fortinet devices into the FortiMonitor platform. This enables digital experience and network performance monitoring at scale. The FortiMonitor platform brings enriched alerting and an incident management toolset to managed devices for proactive monitoring and generating of alerts in response to error conditions.
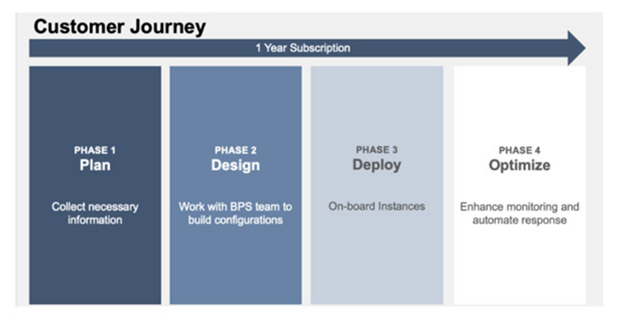
FortiCare Best Practice Services for FortiMonitor
The FortiCare Best Practice Service (BPS) provides technical advice to help organizations make the most of their Fortinet investment. FortiCare BPS is an annual subscription-based service. Once a ticket is created through the FortiCare Support Portal, the BPS ticket is rerouted to a product-specific technical expert. Response for these consultations are handled as per a standard P3 ticket.
Fortinet Services
24x7 FortiCare technical support is delivered through our Global Technical Assistance Centers. Each geographical region has a Center of Expertise that is supplemented by regional support centers. This enables us to provide regional and local language support. Foundational FortiCare device-level support includes:
- Global toll-free numbers that are available 24x7
- Web chat for quick answers
- A support portal for ticket creation or to manage assets and life cycles
- Access to software updates and a standard next-businessday RMA service for the device
Security Fabric
The industry’s highest-performing cybersecurity platform, powered by FortiOS, with a rich ecosystem designed to span the extended digital attack surface, delivering fully automated, self-healing network security.
- Broad: Coordinated detection and enforcement across the entire digital attack surface and lifecycle with converged networking and security across edges, clouds, endpoints and users
- Integrated: Integrated and unified security, operation, and performance across different technologies, location, deployment options, and the richest Ecosystem
- Automated: Context aware, self-healing network & security posture leveraging cloud-scale and advanced AI to automatically deliver near-real-time, user-to-application coordinated protection across the Fabric
The Fabric empowers organizations of any size to secure and simplify their hybrid infrastructure on the journey to digital innovation
Documentation:
Download the FortiMonitor Data Sheet (PDF).
Pricing Notes:
- All Prices are Inclusive of GST
- FortiCare Premium Support
FortiCare Premium Ticket Handling, Advanced Hardware Replacement (NBD), Firmware and General Upgrades - FortiCare Premium plus FortiGuard Bundle Contract
Advanced Hardware Replacement (NBD), Firmware and General Upgrades, Premium Support, FortiDB Security Service (DBS) - Prices are for one year of Premium RMA support. Usual discounts can be applied.
- Annual contracts only. No multi-year SKUs are available for these services.
- Contact Fortinet Renewals team for upgrade quotations for existing FortiCare contracts.
- Pricing and product availability subject to change without notice.